1. Start by going to the WPA. On the left you see a column with your departments and teams in the wpa organization. On the right you can generate statistic reports (green arrow) and get an overview of which years the WPA has been performed for the individual teams (purple arrow). Under "My reports" (red arrow) you can see an overview of previous generated reports.

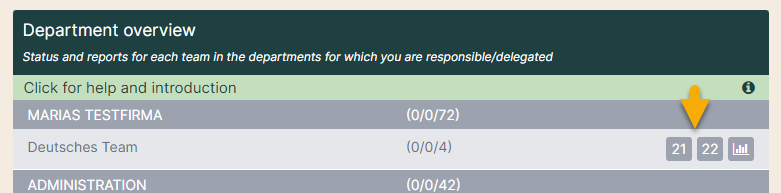
2. You can generate statistics in several ways. If you want to see the trends for a single team, simply click on the symbol with the bar chart next to the team name (yellow arrow).
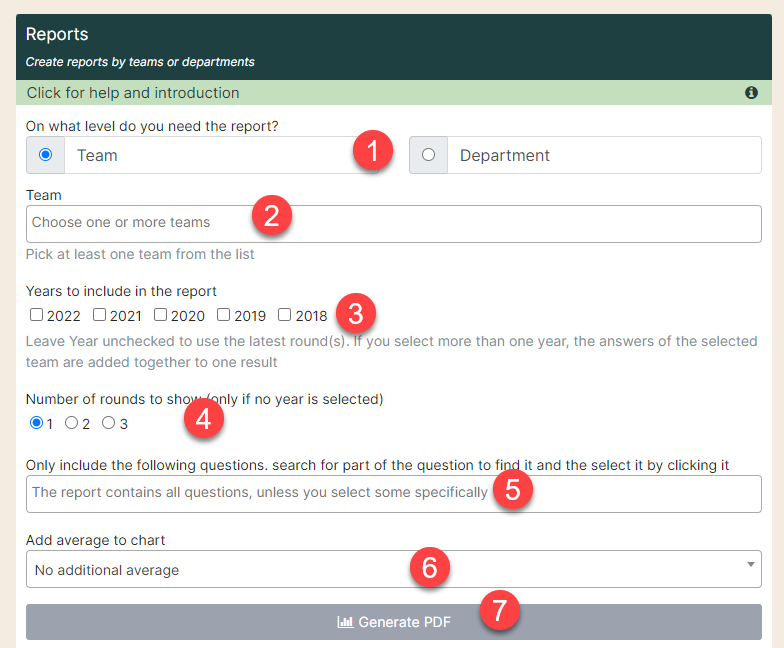
3. If you want to compare data across teams or departments, fill in the box named "Reports".
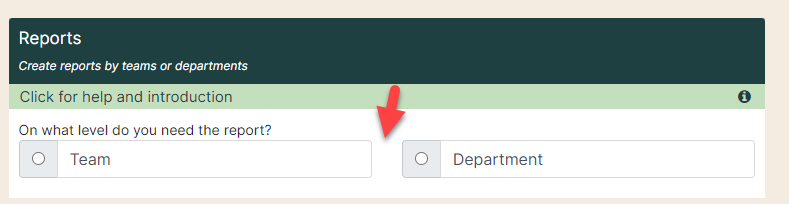
- Team or department level
- Which team (s) or departments should be included in the statistics
- Which years to include in the report
- How many rounds to include
- Choose to generate statistics on specific questions (if the field is empty, all questions are included)
- Choose whether to add an average (no extra average, automatic average, or manual average)
- Finish by creating a PDF file
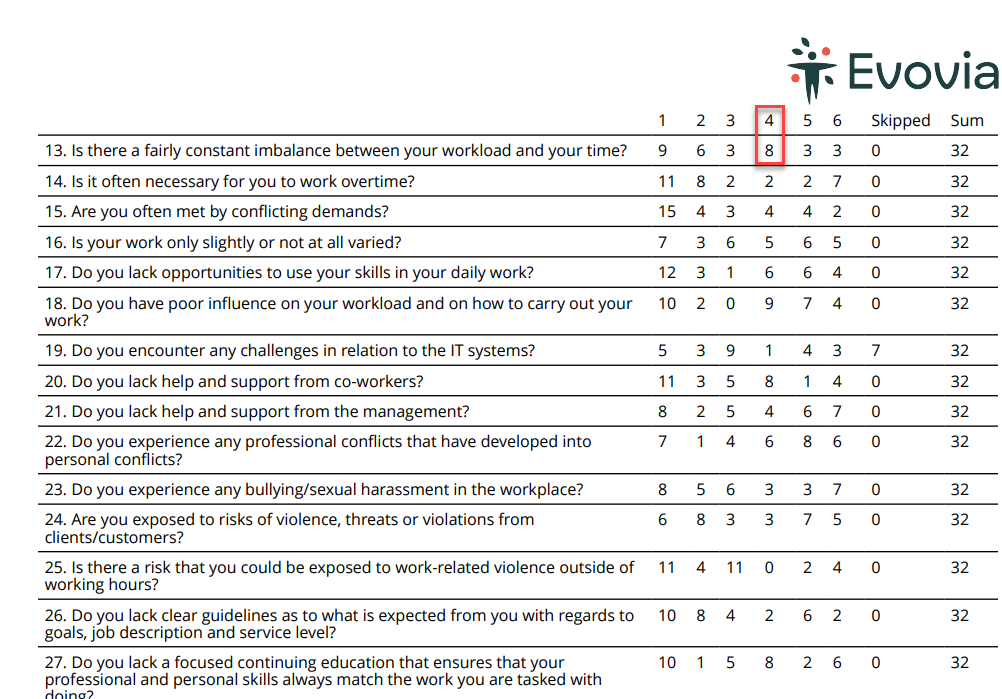
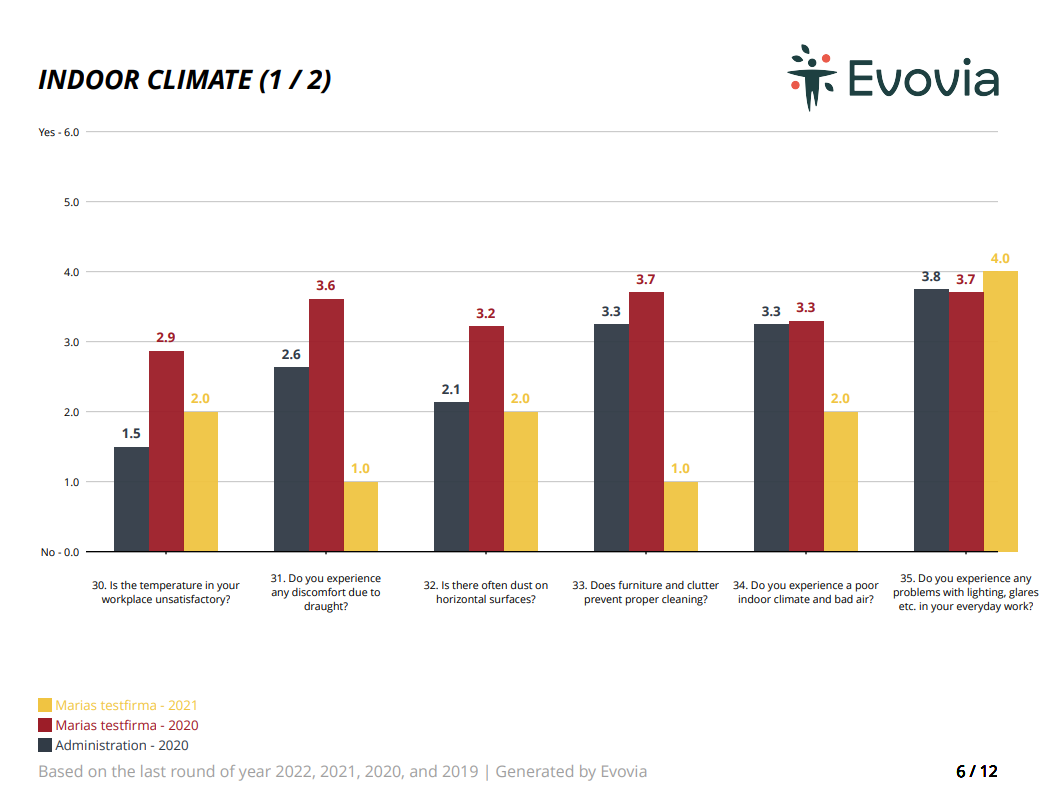
5. The report shows the result of the answers to the selected questions. The report is presented with a company logo if the system is set up for it (see the guide ‘Company logo’ if necessary).
6. At the end of the report, the distribution of scores for the various questions is shown. In this example, 8 people have given the score 4 to the question "Is there a fairly constant imbalance between your workload and your time?".