Process statistics for EDP
As responsible for the EDP, you have an overview of the EDP process of the organizations.
Each manager can see how many EDP’s have been carried out in the manager’s own team. At the same time, the owner, HR and/or department managers/department administrators can also see how many EDP’s have been carried out in the different departments and teams throughout the organisation.
1. Open Process statistics
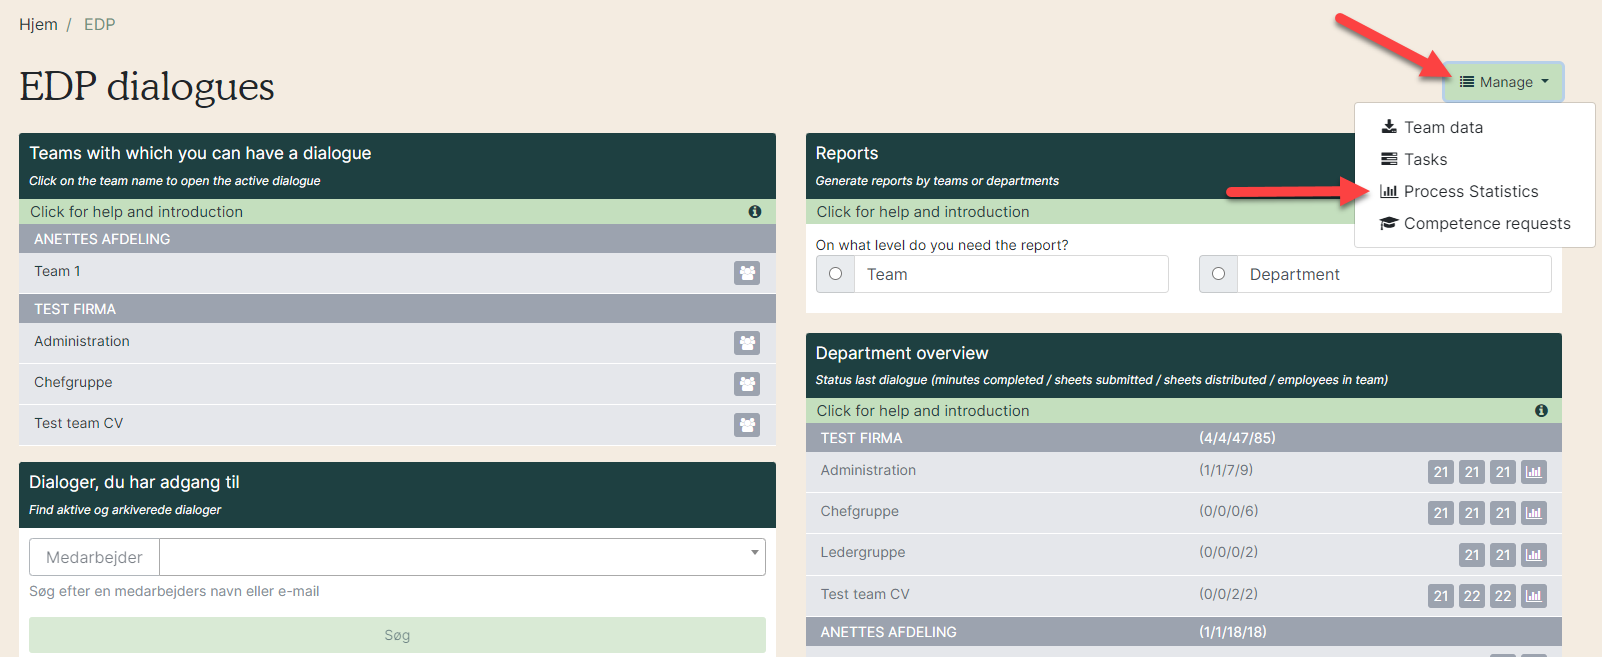
Go to the EDP tool and click ”Manage”. Choose “Process statistics”.

2. Search in Process statistics
There are several options to generate the statistics.

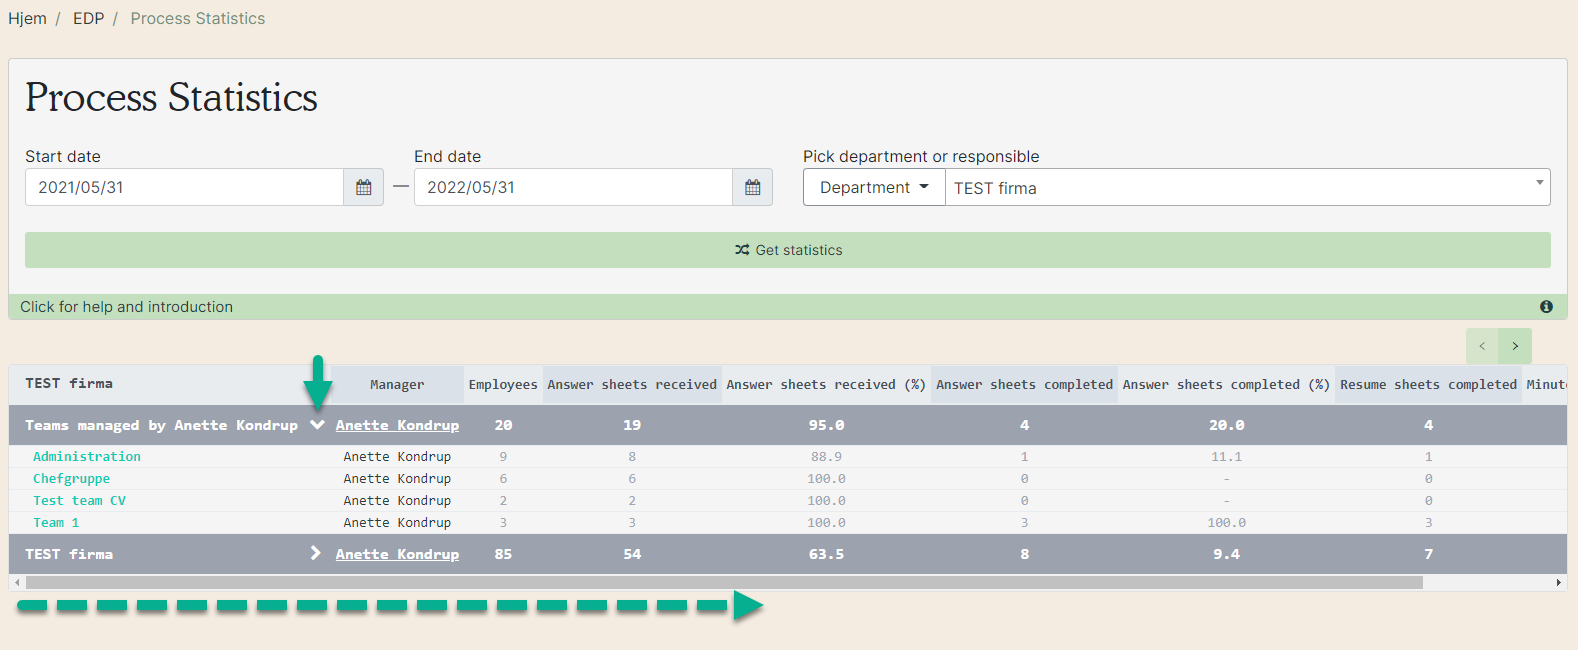
1) Choose a start and end date to see statistics for this time interval. Be aware that this includes all data from EDP’s where the dialogue is started. If you look at the time interval from all of March, minutes from April will count, if the dialogue was started in March.
2) Choose the department you want statistics for. If you have rights to see statistics for the whole organisation (as department administrator, top manager or HR) you can search for a specific manager’s team.
3) Click ”Get statistics”.
4) This is the statistics. Open up teams by clicking the small white arrows (green arrow) and use the grey bar at the bottom to scroll to the side (green dotted arrow).
5) Download as Excell sheet.
6) Scroll to the side.

Columns in the process statistics:
1: Manager: Name of the team manager.
2: Employees: Number of employees in the team as pr. today.
3: Answer sheets received: Number of sent EDP's.
4: Answer sheets received (%): Number of sent EDP's in percentage.
5: Answer sheets completed: Number of completed questionnaires.
6: Answer sheets completed (%): Number of completed questionnaires in percentage.
7: Minute sheets completed: Number of completed minutes.
8: Minute sheets completed (%): Number of completed minutes in percentage.
9: Tasks created: Number of created tasks.
10: Tasks completed: Number of completed tasks.
11: Tasks completed (%): Number of completed tasks in percentage.
3: Watch video
Regarding the statistics
Employees
- When an employee is added or deleted in the main organisation, the number of employees in the team is updated.
Completed questionnaire
- A completed questionnaire will be a part of the statistics even if it has been unlocked.
- If an employee is moved to another team or no longer is a part of the organisation, their completed questionnaire will not be a part of the statistics. The number in the column will automatically be adjusted.
Tasks completed
- If a completed task is re-opened, the statistics will automatically adjust and the task is only included in the "Tasks created" column.
Tasks when an employee is moved to another team or stops
- When an employee is no longer a part of the organisation, their tasks are not included in the statistics. The number of tasks in the columns "Tasks created" and "Tasks completed" will automatically adjust.
- When an employee is moved to another team, their tasks are not included in the statistics for their previous team or new team. The number of tasks in the columns "Tasks created" and "Tasks completed" will automatically adjust.